Manchester City won the league last season, having spent just 15 days at the top of the table. An incredible stat really, especially when you consider Arsenal were top for 128 days, which is practically half of the season.
Was this to do with the relative difficulty of the fixtures? Was it to do with individual teams peaking at different times? Or, was it the fact that City seemed to have a game in hand right up to the final week of the season.
Firstly , a quick retrospective look at last season, using the MatchStory.co.uk graphic, and see how the 2013/14 played out.

If you would like to play around with the interactive version, you can visit MatchStory.co.uk here.
OK – I have the respective difficulties of the fixtures as they were graded at the start of the 2013/14 season. I now need a bench mark, so that I can track each team against their relative ‘expected’ points if they were to win the league.
To do this, I’ve simply taken Manchester City’s total of 86 points, which is an average of 2.3 points per game, and used the table below to weigh each match difficulty with a required points average.

86 points won the league last season, which is an average of 2.3 points per game. By weighing a points average against each of the relative match difficulties, I’ve have come up with a model to project how the season progressed versus the expectations.
Three key Moments of Last Season
Now that I know the projected average points by match difficulty, I can feed this into the MatchStory graphic. This will then give me a ‘projected points total’ after each match has been played.
I can then take the ‘actual points total’ and calculate the difference between the two, which is shown below for three teams:
-
Arsenal – Who, as mentioned earlier, spent 128 days top of the league
-
Manchester City – The eventual league winners, despite only spending 12 days top of the league
-
Liverpool – Who put in a solid challenge, especially in the latter stages of the season, only to fall short in the final few games

The reason I have chosen these three teams is simply for the retrospective. I know that Chelsea were in the title race, and next season, it could be even tougher with Manchester United back in the mix. For now though, I am just focusing on these three teams, since there were three key moments during last season that heavily influenced the league title landing where it did.
1. 11 Games Played
After 11 games, Arsenal were sitting top of the league, 1 point ahead of Liverpool. This is despite Liverpool performing below expectation in this model. Also, Manchester City got off to a terrible start if you remember, and this is how the table looked after 11 games (just these three teams).

Out of the three teams, only Arsenal were performing above expectations. From game 12 to 24 though, Manchester City clawed back the gap significantly. Liverpool’s resurgence came later.
Arsenal were off to a great start and maintained their performance ‘above expectation’ beyond the mid point of the season. Liverpool, on the other hand, were way ‘off track’, despite sitting in second place.
Manchester City who went on a resurgent run of form from matches 12 to 24, in which they closed their gap from ‘actual points’ to ‘expected points to just -0.4. At this point, Arsenal were -0.1 point. Liverpool were way off the pace, a massive -9.4 points off their target.
Then match 25 took place.
2. The 25th Match
Any guesses what the 25th match was?
First off, match 25 for Manchester City was a surprising 0-0 draw against Norwich City. This came on the back of another surprise – their defeat at the Ethiad against Chelsea.
What about Arsenal and Liverpool?
It doesn’t take a genius to guess it was that game. Yes, the game in that Neil Atkinson wrote about so exceptionally well for The Anfield Wrap. It was Liverpool 5 Arsenal 1.

Liverpool’s demolition of Arsenal got Liverpool back on track. Arsenal were shell shocked, and never really recovered.
Arsenal went into freefall. That great start fell to pieces, and over the next 9 games, they found themselves dropping 8.4 points against their ‘expected points’ accumulation. It wasn’t until Everton were breathing down their neck for the covereted 4th spot, that Arsenal started to gradually get back their form, but it was all too late.
Liverpool went on a fantastic run, winning game after game. 11 wins in a row to be exact, the best winning streak in the league last season. This played Liverpool back into the title race and, ultimately, put it in their hands after beating Manchester City.
Then Liverpool played Chelsea.
3. Liverpool lose to Chelsea
I am not going to dwell too much on this moment, I think all us Liverpool fans can accept that was the moment where we ‘lost’ the league title. It was down as one of the hardest 4 games of the season, meaning that the expectation was to get 1.5 points. In isolation, this is impossible of, a draw is worth 1 point, and even that could have been enough.

A picture speaks a thousand words: This was the moment the title slipped from our grasp.
It didn’t happen though, and the subsequent draw to Crystal Palace put what felt like the final nail in the coffin.
Based on all this then, what can I learn from this retrospective analysis of last season? Does the order and respective difficulty of matches play a part over the season? And, just how will next season shape up?
Does fixture order matter?
Before I answer this question, I want to explain some limitations in this model.
-
Difficulty is set at the start of the season and is not dynamic as teams become stronger or weaker over the course of the season
-
For example, Crystal Palace away may have been an ‘easy’ game at the start of last season, by the end though, a resurgent Palace were a different beast
-
It also doesn’t account for changes in fixtures or games in hand, which played a key role in Manchester City title challenge
-
Since it is an ‘average expected points’ it assumes that teams pick up points in every game, which is very rarely true
-
It predicts that each team will get 86 points, again, this is very unlikely over the course of the season
With that in mind then, here is the excellent Match Story graphic for next seasons fixtures. The five teams I will focus on are the teams which most bookies are tipping for the title this coming season:
Manchester City
Liverpool
Chelsea
Arsenal
Manchester United
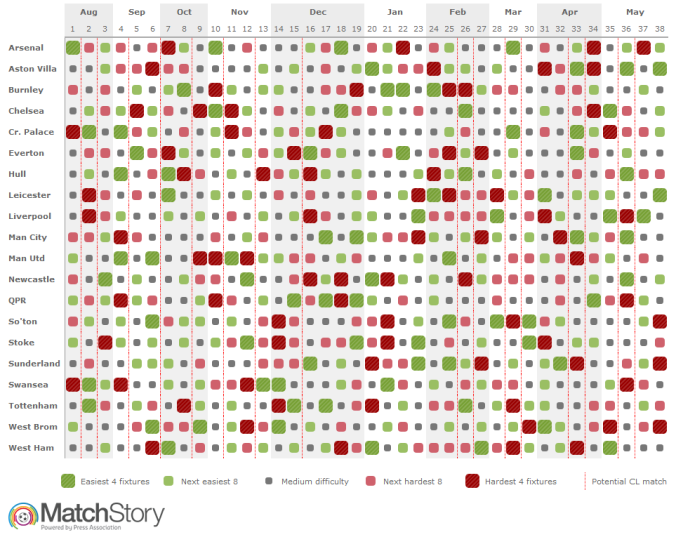
Visually, you can instantly see who has the the toughest start.
Manchester City, in their first 8 games, have three ‘Hard’ games with one ‘Very Hard’ game. Their local rivals, Manchester United, have two ‘Very Easy’ games and not one ‘Hard’ or ‘Very Hard’.
How could the table look after 8 games then?

If all the top five teams are to be on track for the league title after eight games, Manchester United could have a 4 point gap over last seasons winners Manchester City. Wouldn’t that be some turn around for Van Gaal?
However, things start to change as we hit the mid point of the season.

No surprise at the mid point, things are starting to look a little tighter at the top, with only 1.3 points separating 5th and 1st place. It is likely that each team has played every team once, so there are only very small variations in difficulty at halfway.
What about the final run in, who could be in the top position, if the season strictly followed these rules?

It could be Manchester United back in top spot, with the chasing pack within touching distance.
At at the end of the season? Well, they could all have 86 points.
Of course, in reality, it is highly unlikely that the season will pan out like this. As I showed you earlier, teams will dip in and out of form throughout the season, meaning that the ‘actual points’ totals will vary. The important number will be the difference between the ‘projected points total’ and the ‘actual points total’.
Still, there are a few things we can learn from the ‘projected points’ of each team.
-
Manchester United have the easiest start, and if they do start well, can they sustain it?
-
If Manchester City are top of the league after 8 games, they will be ahead of their projected position, which will mean that others have to play catch up
-
Liverpool don’t have to be top of the league after 8 games, especially considering they have two tough away games in their first 3 games

This graph shows how a season would play out if the League rivals all played to ‘expected points total’s. In smaller chunks, the points swing can be significant. It will all even itself out in the end though.
Winning the League – A Marathon, not a Sprint
With all this in mind, hopefully I have shown you that fixture order can matter. The graph above illustrates this, despite being a little chaotic.
Over the course of next season, based on the ‘projected points totals’, it will be rare to see significant gaps between the teams ‘expected points totals’.
Most interesting are the two Manchester clubs though.
Due to Manchester United’s easier start, their ‘projected points total’ would have them top of the league for most of the season. Where as Manchester City would be lagging behind, with a number of their ‘easy’ fixtures coming towards the end.
Could Manchester United, with their new manager, do what Arsenal did last season? Start well only to fade in the middle? Could Manchester City do what they themselves did last season, track behind the league leaders for most of it, only to win it in the final few games?
Time will tell.
In the end though, every team has to play every other twice, so the ‘projected points totals’ all even out in the end. As I mentioned earlier, there are some limitations with this model, and the real test is how teams perform against their actual points totals.
And that is exactly what I will be tracking this coming season (2014/15).
Thank you for taking the time to read this, and thank you to MatchStory.co.uk for allowing me to use their graphics and insight. Over the course of the 2014/15 season, I will periodically be updating my blog with how each team is performing relativel to their ‘expected points total’. How will each team perform? Who can get ahead? Who will be lagging behind? And importantly, who will be sitting top of the league come May? Check back throughout the season, or follow me on @ThisIsAnalysis for my latest posts.